Tracking Conversion Rates on the Ghost platform with Amplitude
How good can I get at "selling" subscriptions? Out of the things I enjoy writing about, which are the most interesting to people? What metrics can I collect that are interesting and actionable?

One of my reasons for writing this newsletter is to learn more about internet marketing and analytics. How good can I get at "selling" subscriptions? Out of the things I enjoy writing about, which are the most interesting to people? What metrics can I collect that are interesting and actionable?
To that end, I wanted to start tracking the conversion rates for each of the articles on my Ghost site. Which articles are the best at making people say, "I want more of that?" Do people primarily subscribe from articles, or are they subscribing directly from the home page? It was surprisingly hard to find information on conversion statistics for Ghost subscriptions, so I ended up cobbling together a solution out of a couple of different scraps of documentation. I've written that solution up here in the hopes that it will be useful to at least a few folks out there.
Why Amplitude?
At first I thought that Google Analytics would do this automatically – it claims to have conversion tracking, after all – but due to the way the Subscribe flow works on Ghost the automatic integration can't detect those clicks. There are a couple of other analytics integrations available for Ghost, but I chose Amplitude, because I'd like to learn more about it in case I want to use it on a more complex product, and because it's free at this website's current scale. (Shout out to John Cutler here, who has done a great job of convincing me that Amplitude knows what they're talking about in regards to product development. Read his stuff if you're at all interested in product, change agency, and decision-making at large organizations.)
Set up an Amplitude account
If you don't have an account already, create a free account, and follow the instructions to create an organization and a project.
Get the Amplitude installation code
Once you're logged into your Amplitude account and you have a project set up, find "Sources & Destinations," and then "Add Data Source." Select "Javascript SDK" and copy the Javascript code snippet.
Paste your installation code into your Site Header
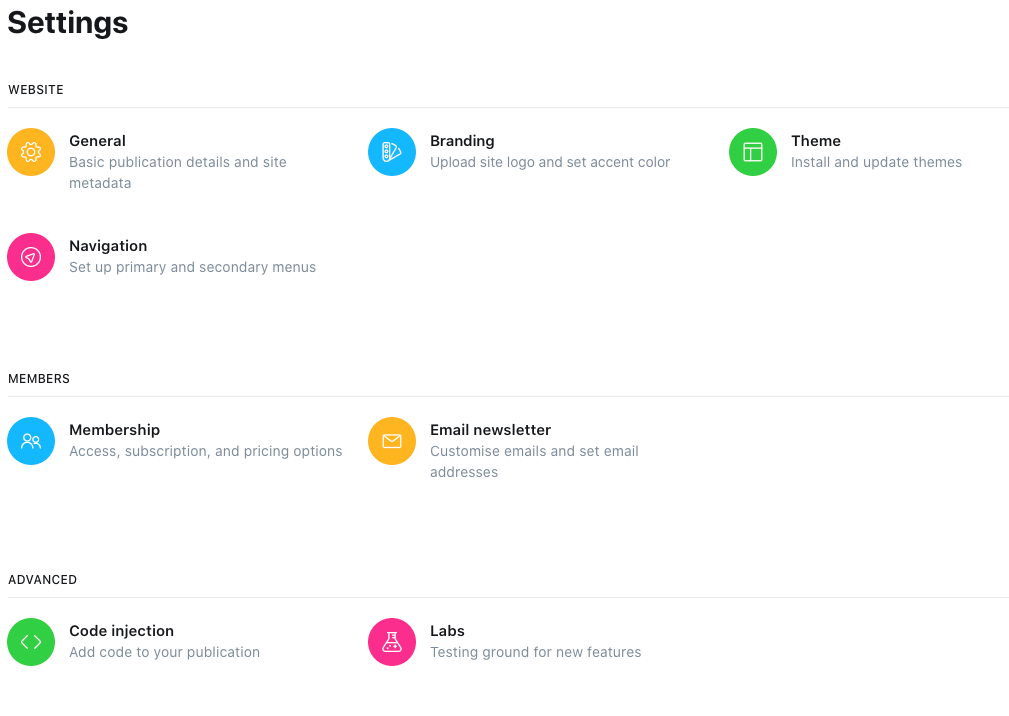
In the Settings page, there's a link for Code Injection, in the lower left hand corner of the page.
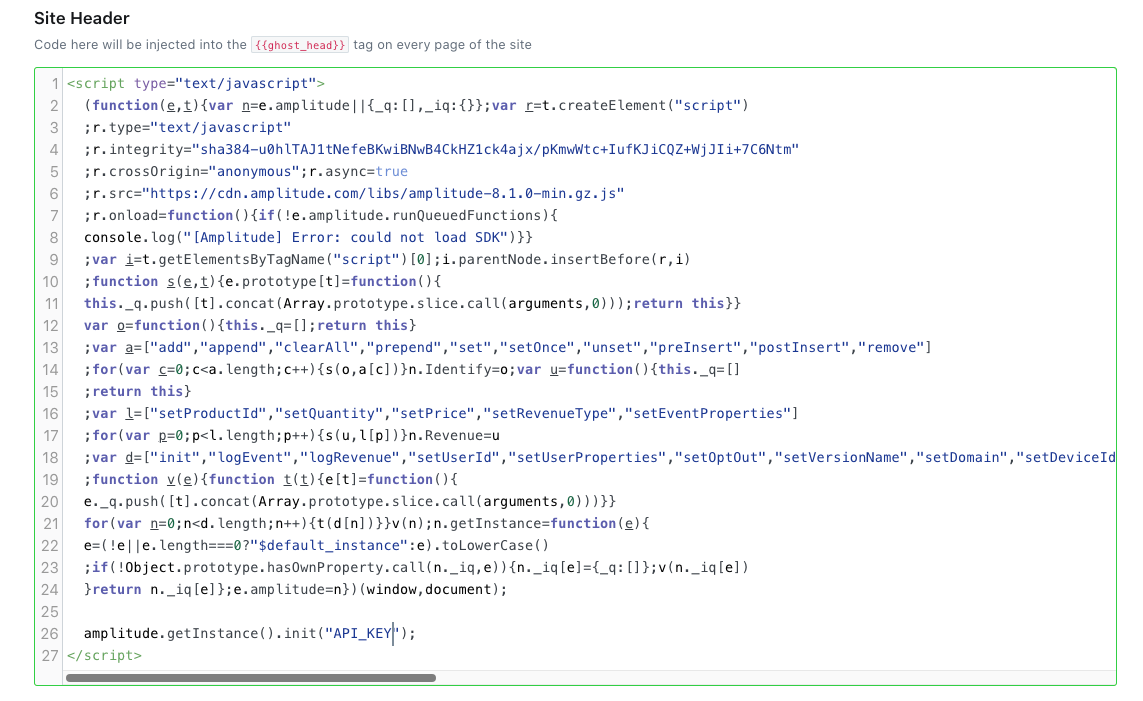
Paste the installation code, with your API key, into the Site Header. It should look something like this:
Add the View Page event
Once your page has called amplitude.getInstance().init() you can call logEvent . To send every page view to Amplitude, with a property that tells you which page, paste the following into the Site Footer.
<script type="text/javascript">
    amplitude.getInstance().logEvent("View Page", {'page': document.title});
</script>
Now every time any page loads on your site, that event will automatically fire.
Add the Click Subscribe event
This one's a little trickier, since you'll need to modify the behavior of an existing element on the page. Paste the following into the Site Footer.
<script type="text/javascript">
function addEvent(element, type, fn) {
    var old = element['on' + type] || function() {};
    element['on' + type] = function () { old(); fn(); };
}

var a = document.getElementsByClassName('gh-head-button')[0];

function subscribeClick(){
    amplitude.getInstance().logEvent("Click Subscribe", {'page': document.title});
}

addEvent(a, 'click', subscribeClick);
</script>
This code will also run every time a page loads, but instead of just firing an event, it looks up the "Subscribe" button element by class, and then attaches a "subscribeClick" function that runs every time that button gets clicked. That function looks up the title of the current page, and sends an event to Amplitude with that title as the same property we used in the "View Page" function.
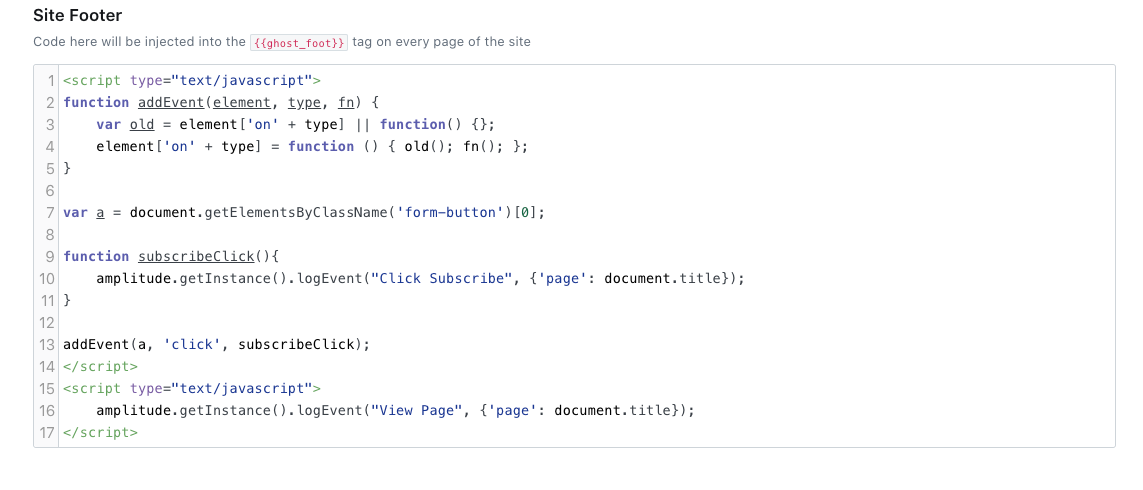
Your Site Footer should now look something like this:
Create a Funnel Analysis in Amplitude
Now click on a few pages on your site, and the Subscribe button at least once, to generate some data for Amplitude.
Over in Amplitude, create a new chart, and select "Funnel Analysis." Configure it to use your View Page and Click Subscribe events, in that order.
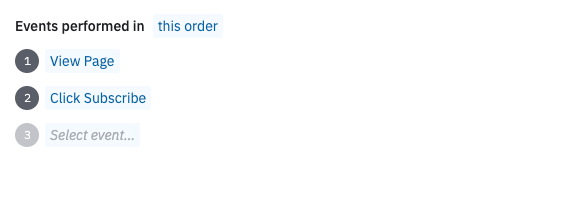
Break that down by "Step 1" and the "page" property and you should see a graph that looks something like this.
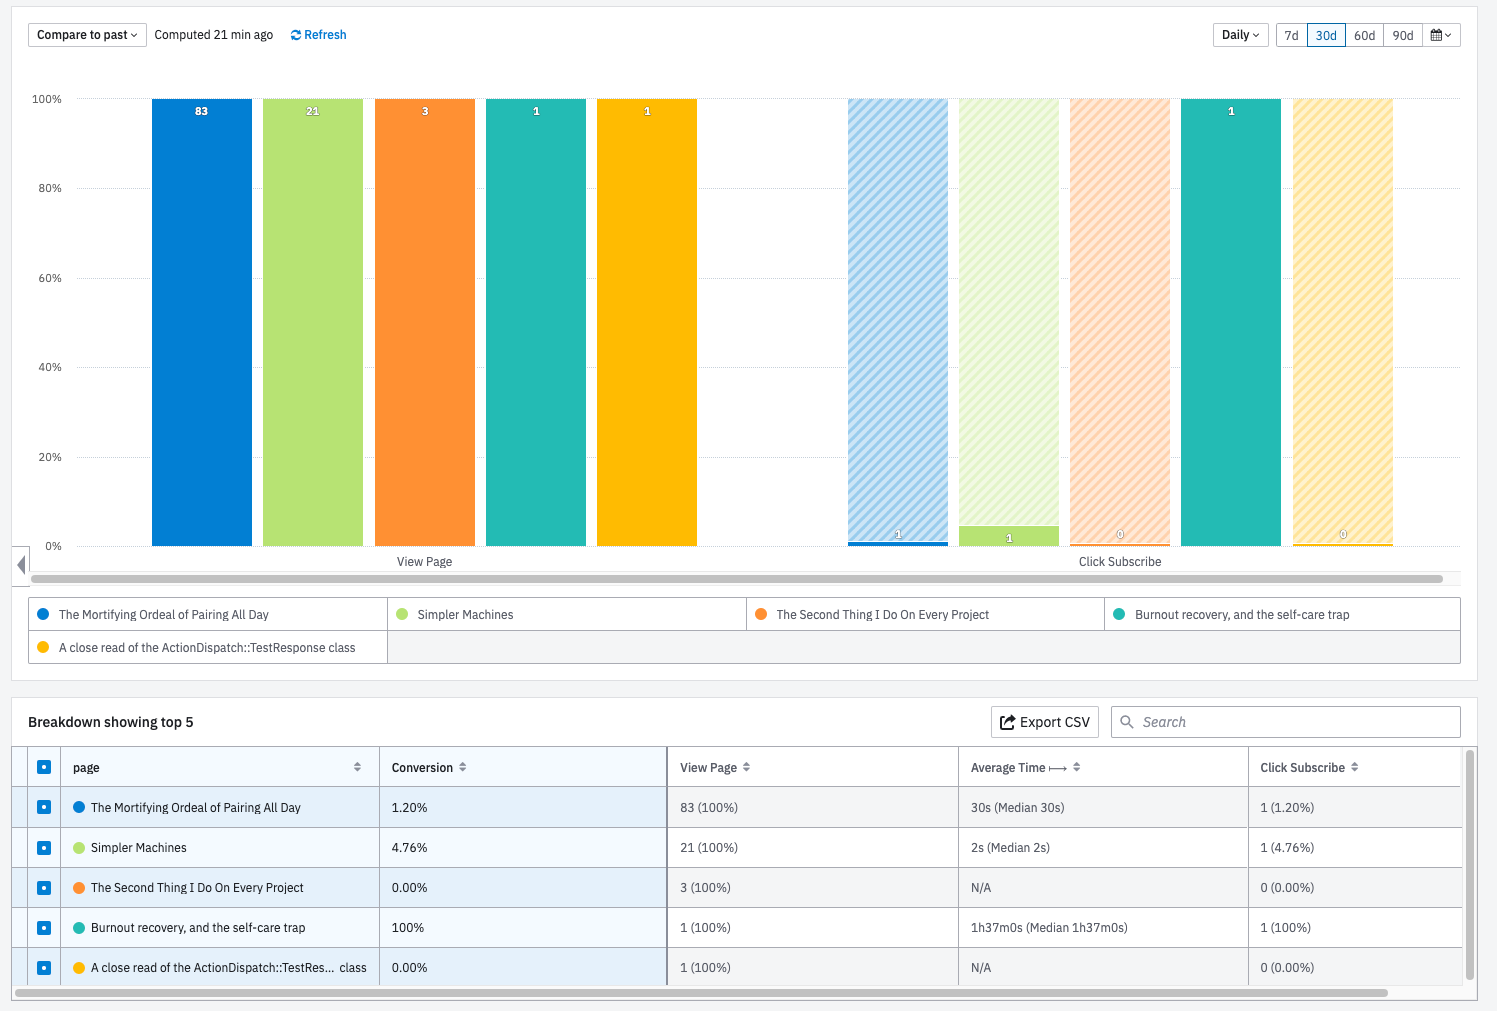
At this point the integration has been running for a few days, so I'm starting to get some real data in, not just test info.
The first thing this tells me is that recording "Subscribe" clicks may not be sufficient to get the data I want. There are several "Subscribe" events here that haven't shown up in my actual Subscription. "Subscribe" just brings up the form, it doesn't submit it, and then once the form gets submitted the reader needs to click on the link the e-mail it sends to complete the flow. I may need to learn how to track those events to get the information I want.
Unfortunately, there's too little information so far for me to say more yet. There are different Conversion rates for each article, but note that each one is based on just a single Subscribe click. While it's possible to make hypothesis based on very limited data, I'd still like to see a bit more before I consider changing behavior. So, in a few weeks, we'll come back and explore what I might change based on these metrics.